New Capital is part of EFG Asset Management. For more information visit: www.efg.com
Investment Insights
Infocus - The effective exchange rate of the renminbi
In this issue of Infocus, EFG Chief Economist Stefan Gerlach looks at the drivers of the tradeweighted nominal exchange rate of the renminbi. He argues that it evolves over time in response to the difference between inflation in China relative to its trading partners and real economic activity in China. With real GDP, at best, forecast to grow in line with its trend – albeit with considerable downside risk – and with inflation likely to remain below that of its main trading partners, the outlook is for continued renminbi weakness.
While policymakers in the US and the European Union do not place much emphasis on exchange rates as an input into the decision-making process, the exchange rate is a key policy variable in China.
With a financial system that is not yet fully integrated, the People’s Bank of China sets several different interest rates in managing monetary policy. With no single policy rate – no federal funds rate as in the US, no deposit rate as in the euro area and no Bank rate as in the UK – that policymakers can change to influence broad macroeconomic conditions, the exchange rate offers an effective additional tool to influence the level of demand in the economy.
It is reasonable, therefore, to ask what economic factors Chinese policymakers are most responsive to when setting the exchange rate. Policymakers’ concerns often focus on the exchange rate vis-à-vis all trading partners and the attention here is therefore on the nominal effective exchange rate (NEER) of the renminbi.
The NEER of the renminbi
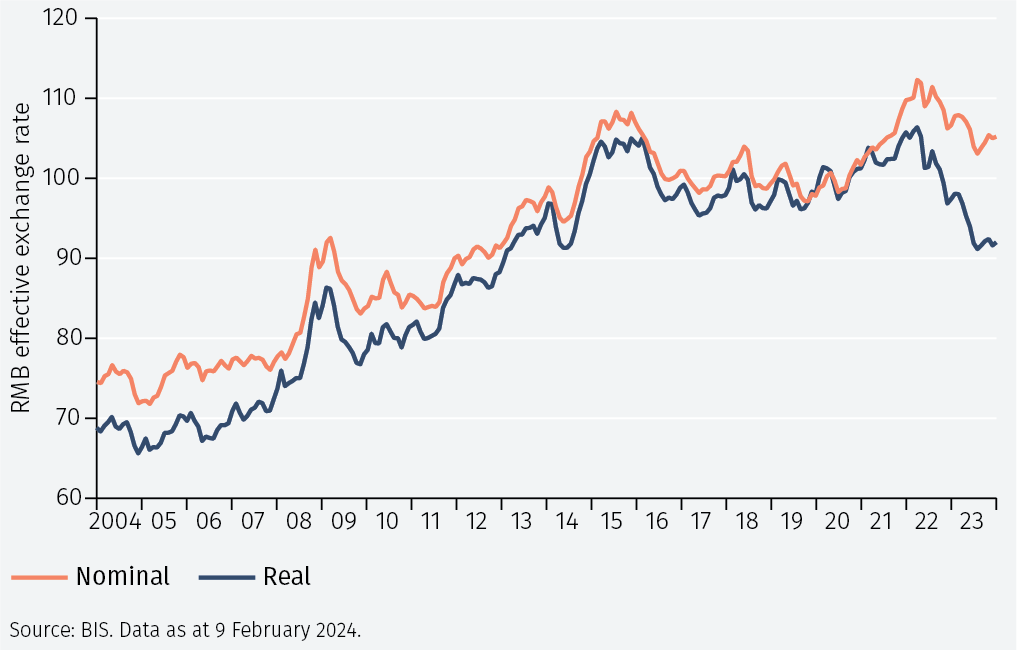
The NEER can be measured in several ways depending on what precise basket of exchange rates is considered. The Bank for International Settlements (BIS) constructs measures of both the nominal and real effective exchange rates, using consumer prices, for China and its trading partners. That is helpful because it makes it possible to compute the price level in China relative to its trading partners. It is the measure used here. Figure 1 shows the nominal and real effective exchange rates for China between 2004 and 2023. It is useful to distinguish between two periods. During the first period from 2004 to 2015, the renminbi appreciated gradually, except for some fluctuations around the time of the global financial crisis in 2008-9. The currencies of quickly growing economies often appreciate in both nominal and real terms in this way.
The second period starts in 2015. Since then, the real exchange rate has fluctuated around a broadly constant level, although since 2022 it has depreciated both in real and nominal terms.
The focus here is on the latter period. If the exchange rate is set (or heavily influenced) by policymakers, why did they desire a stronger exchange rate in 2015 and 2021 and a weaker exchange rate in 2016 and 2022-23?
Central banks often let their exchange rate move to help manage inflation. If inflation at home is higher than abroad, they may let the exchange rate strengthen to lower the cost of imports. Similarly, if inflation is too low, they may let the exchange rate depreciate to push up inflation.
They can also use the exchange rate to control economic activity. If the economy is overheating, it can strengthen the exchange rate to constrain foreign demand and shift domestic spending to foreign goods. And if the economy is slowing, it can weaken the exchange rate to stimulate exports and boost domestic demand. As we see below, these factors appear to have played a role in Chinese exchange rate policy in the period under study.
Macroeconomic conditions and the NEER
As noted above, using the BIS data we can compute the rate of inflation in China’s trading partners minus the rate of inflation in China. Figure 2 shows this relative inflation rate for the period 2016-2023.
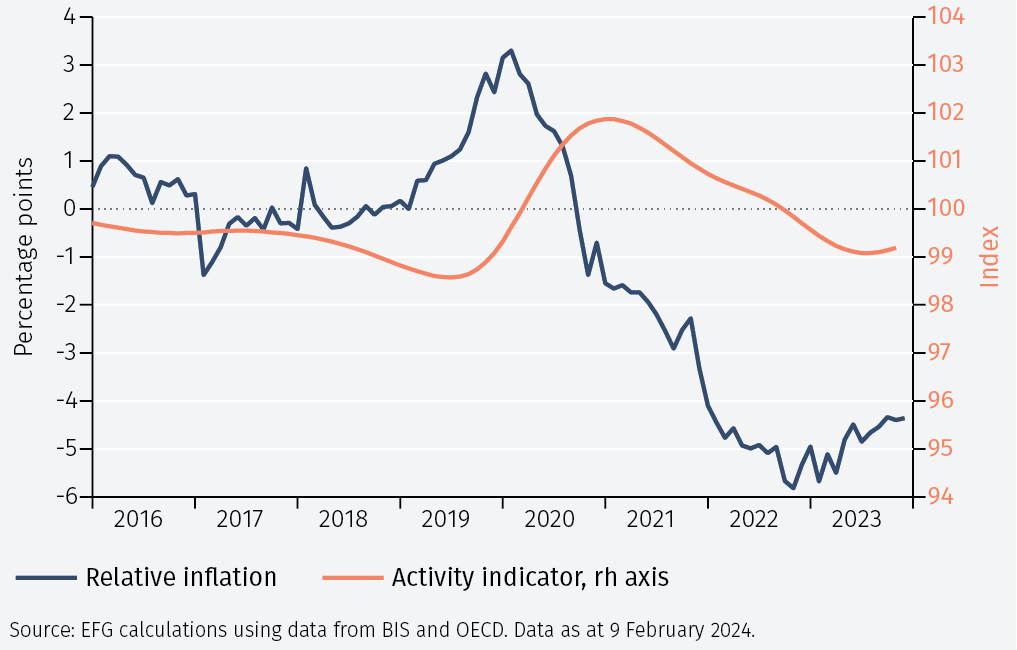
Figure 2 demonstrates that inflation in China was broadly similar to that of its trading partners until early 2019. Chinese inflation then started to rise above inflation in its trading partners. That situation reversed itself in early 2020. Since then, the relative price of the Chinese consumer basket has been falling as Chinese inflation has been below that of its trading partners.
Next, we turn to economic activity in China. Figure 2 shows an ‘activity indicator’ given by the reference series for real GDP in China, published by the OECD. This is a de-trended and smoothed series of monthly real GDP used in the construction of the OECD’s leading indicator.
Economic activity was weak before 2020, particularly in 2019, but then started to rise sharply reaching a peak in early 2021. Since then, real GDP has been declining but appears to have reached a trough at the end of 2023.
Analysis
To investigate further the relationship between the exchange rate, relative inflation rates, and the activity indicator, a simple statistical analysis is conducted. The analysis seeks to explain the NEER as a function of the relative inflation rates and the activity indicator for China. The role of monetary policy in other countries in driving the Chinese NEER is not modelled explicitly but included in the residual. The sample period is 2016-2023 so it includes the 2022-23 period during which the variables in the model experienced large fluctuations, making it likely that this part of the sample will be particularly informative. (Technical details are provided in the Appendix).
The model indicates that relative inflation rates and the activity indicator impact strongly on the exchange rate in the way hypothesized above. That is, the authorities have indeed let the exchange rate strengthen as Chinese inflation rose above that of its trading partners and as the activity indicator improved.
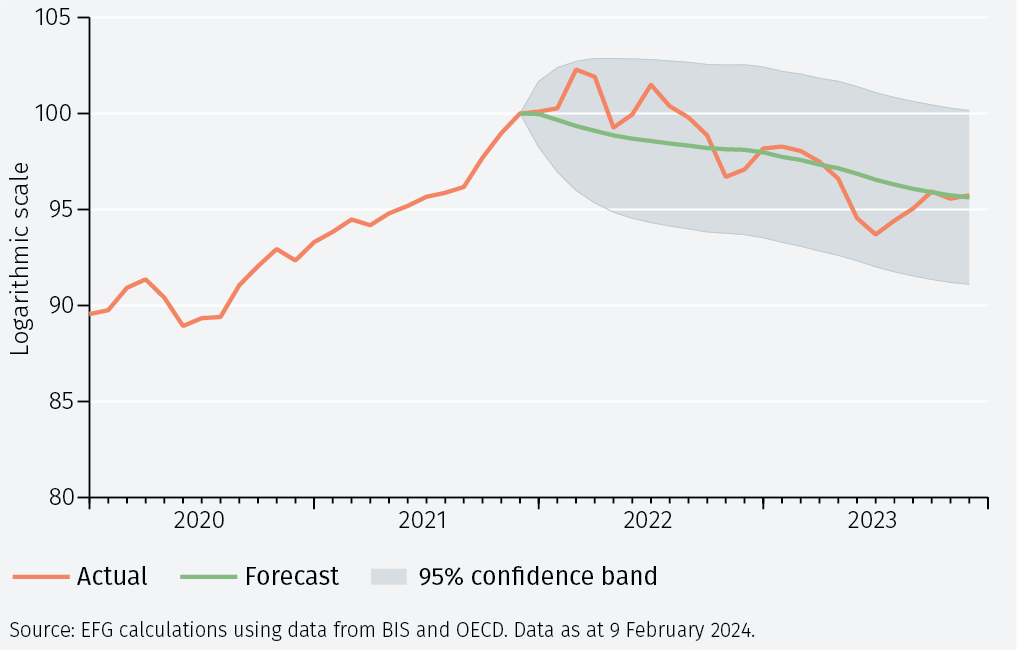
To see how well the model explains the NEER, Figure 3 shows forecasts of the exchange rate for the period 2022-23, given the evolution of the inflation differential and the activity indicator, together with a 95% confidence interval. The NEER has been normalized to 100 in December 2019.
As can be seen, the model forecasts a depreciation of the NEER by 4.5% in the 2022-23 period. The actual NEER fell in this period by 4.6% and always stayed within the confidence band. This suggests that the model captures important aspects of the determination of the Chinese NEER.
Conclusions
The work reported on here views the NEER for the renminbi as determined by systematic policy reactions by the Chinese authorities to macroeconomic conditions. The results indicate that higher inflation in China than in its trading partners and a rising activity indicator results in a desire for a stronger exchange rate. Importantly, the empirical model does a good job in accounting for exchange rate changes.
While many commentators are sceptical about the outlook for growth, the most recent forecast by the ASEAN+3 Macroeconomic Research Office (AMRO), published in January, is for 5.3% real GDP growth in 2024. Thus, economic activity may evolve in line with its trend, although the risks are plainly to the downside. Furthermore, AMRO forecasts continued low inflation of 1.4% in 2024, suggesting that inflation in China will remain below inflation in its major trading partners. Both factors point to continued weakness of the exchange rate.
Important Information
The value of investments and the income derived from them can fall as well as rise, and past performance is no indicator of future performance. Investment products may be subject to investment risks involving, but not limited to, possible loss of all or part of the principal invested.
This document does not constitute and shall not be construed as a prospectus, advertisement, public offering or placement of, nor a recommendation to buy, sell, hold or solicit, any investment, security, other financial instrument or other product or service. It is not intended to be a final representation of the terms and conditions of any investment, security, other financial instrument or other product or service. This document is for general information only and is not intended as investment advice or any other specific recommendation as to any particular course of action or inaction. The information in this document does not take into account the specific investment objectives, financial situation or particular needs of the recipient. You should seek your own professional advice suitable to your particular circumstances prior to making any investment or if you are in doubt as to the information in this document.
Although information in this document has been obtained from sources believed to be reliable, no member of the EFG group represents or warrants its accuracy, and such information may be incomplete or condensed. Any opinions in this document are subject to change without notice. This document may contain personal opinions which do not necessarily reflect the position of any member of the EFG group. To the fullest extent permissible by law, no member of the EFG group shall be responsible for the consequences of any errors or omissions herein, or reliance upon any opinion or statement contained herein, and each member of the EFG group expressly disclaims any liability, including (without limitation) liability for incidental or consequential damages, arising from the same or resulting from any action or inaction on the part of the recipient in reliance on this document.
The availability of this document in any jurisdiction or country may be contrary to local law or regulation and persons who come into possession of this document should inform themselves of and observe any restrictions. This document may not be reproduced, disclosed or distributed (in whole or in part) to any other person without prior written permission from an authorised member of the EFG group.
This document has been produced by EFG Asset Management (UK) Limited for use by the EFG group and the worldwide subsidiaries and affiliates within the EFG group. EFG Asset Management (UK) Limited is authorised and regulated by the UK Financial Conduct Authority, registered no. 7389746. Registered address: EFG Asset Management (UK) Limited, Park House, 116 Park Street, London W1K 6AP, United Kingdom, telephone +44 (0)20 7491 9111.
What type of investor are you?
to view the content you have selected, please choose your country/region and then investor type from the menu:
![]()
You’re about to leave EFGAM website and enter into a 3rd party website
Third party website disclaimer
You are about to enter a third party website, which is owned and operated by an independent party over which EFGAM has no control ("3rd Party Website"). Any link you make to or from the 3rd Party Website will be at your own risk. Any use of the 3rd Party Website will be subject to and any information you provide will be governed by the terms of the 3rd Party Website, including those relating to confidentiality, data privacy and security.
EFGAM does not endorse or approve and makes no warranties, representations or undertakings relating to the content of the 3rd Party Website. EFGAM disclaims liability for any loss, damage and any other consequence resulting directly or indirectly from or relating to your access to the 3rd Party Website or any information that you may provide or any transaction conducted on or via the 3rd Party Web site or the failure of any information, goods or services posted or offered at the 3rd Party Website or any error, omission or misrepresentation on the 3rd Party Website or any computer virus arising from or system failure associated with the 3rd Party Website.
By clicking "Proceed", you confirm that you have read and agreed to the terms herein.