New Capital is part of EFG Asset Management. For more information visit: www.efg.com
Investment Insights
Infocus - A rule of thumb for the US labour market

The latest US labour market report released on 8 March contained mixed messages. While the headline change in non-farm payrolls was much stronger than expected, the previous month’s data was revised significantly lower and there was an increase in the unemployment rate. With so much information contained within the report, it can be difficult to interpret. Daniel Murray reviews the data in this edition of Infocus and suggests a rule of thumb for thinking about the state of the US labour market.
The monthly US labour market report (The Employment Situation) is one of the most closely-watched statistical releases and markets can experience dramatic shifts dependent on the data that are published. However, there is a vast amount of information contained in the report so it can be difficult to know which data to focus on. Furthermore, the numbers can be volatile from month-to-month. It is therefore useful to think about the longer-term characteristics and to view each release in that context.
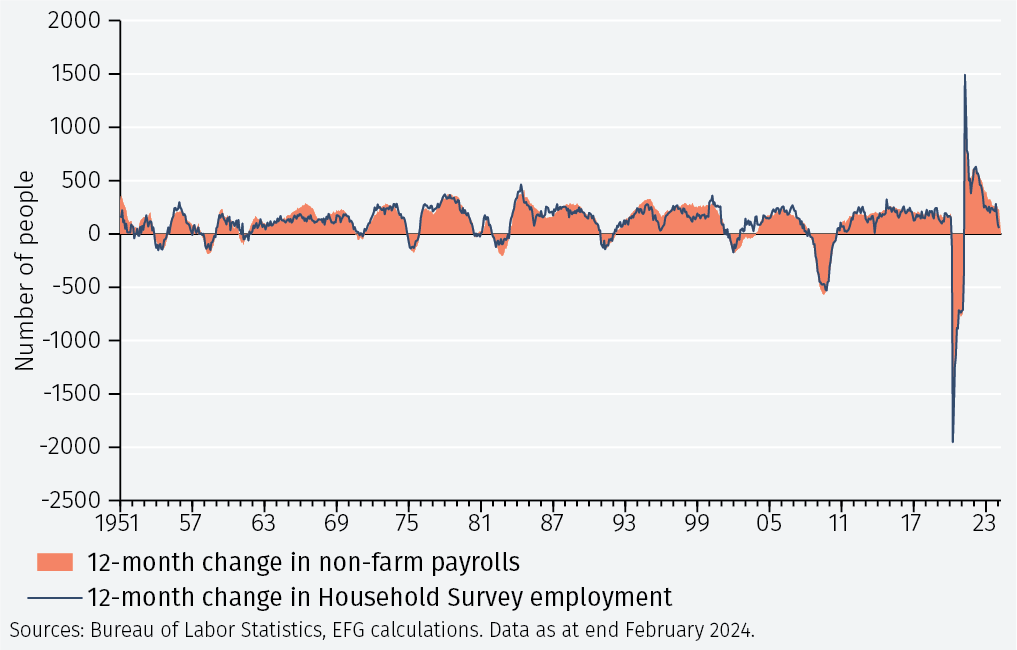
The most heavily-watched data point within the monthly report is the headline change in non-farm payrolls. This is derived from the Establishment Survey, which asks companies how many people they employ. Separately, there is the Household Survey, which asks individuals whether they are employed and from which the unemployment rate is derived. The two can deliver starkly different messages in an individual month. For example, in the latest report non-farm payroll employment increased by 275,000 while household employment declined by 184,000. However, as one would expect, they line up well when the comparison is over 12 months, as shown in Figure 1.
The change in non-farm payrolls is important in terms of its influence on monetary policy decisions. The Fed has indicated that it thinks the labour market is tight although in better balance than it was. In conjunction with elevated inflation, this has been a decisive factor in the Fed tightening policy. A critical question therefore relates to what change in non-farm payrolls is consistent with stability in the labour market.
If the change in non-farm payrolls is less than this threshold then the labour market will be getting looser, something that may encourage the Fed to consider easing policy. If the change in non-farm payrolls is above the critical threshold, this will give the Fed greater cause for concern that labour market conditions are getting tighter. Thinking about the labour market in relation to that threshold also provides valuable information on the state of the economy. If the change in non-farm payrolls is consistently below the critical level then this is a strong indication that economic growth is slowing.
Firstly, note that the US working age population has been growing at a compounded annual rate of around 0.7% per annum over the last five years. The US working age population is currently around 267.9 million. If the population of working age grows at the same rate over the next year as it has over the previous few years, it would grow by an additional 2.0m people.
Next, it is necessary to make an assumption about the participation rate. That is, what proportion of the working age population are either in work or unemployed and actively looking for a job. The latest Employment Situation report for February shows the participation rate at 62.5%. Moreover, this has been surprisingly stable over the past few years. If this remains broadly unchanged over the next year then the labour force would grow by 1.2m people.
The final step in the calculation estimates how many jobs would need to be created for the unemployment rate to remain unchanged. The unemployment rate is currently 3.9%, which implies that an additional 1.2m people would need to be employed over the course of the next year for the unemployment rate to neither increase nor decrease. This equates to a monthly increase in employment of 98,000 people, which is the all-important threshold level.
Figure 2 illustrates the calculation:
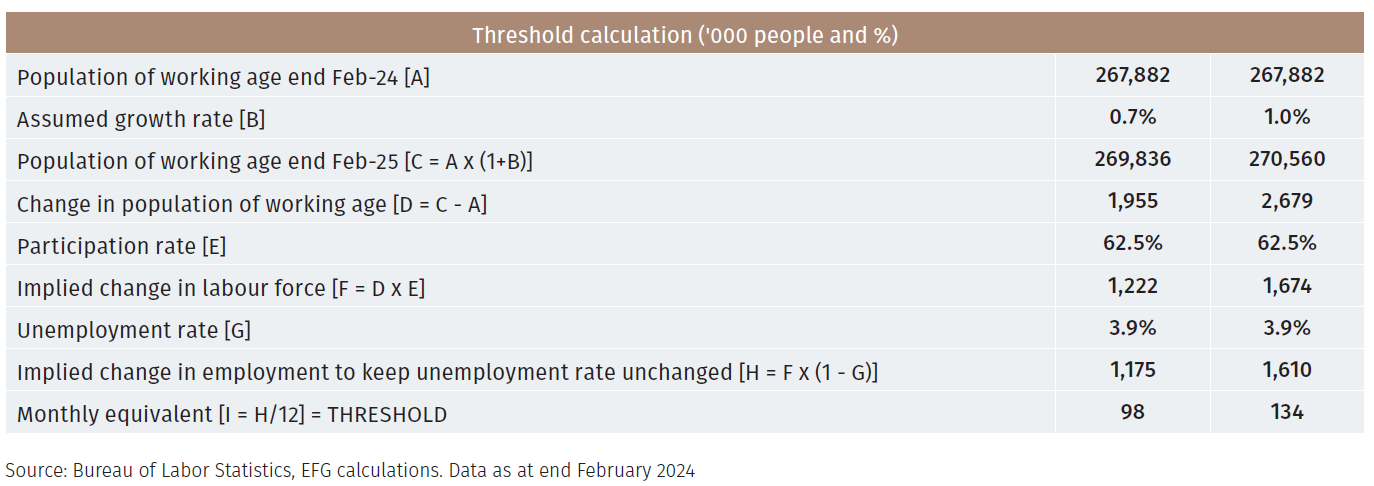
There are a number of moving parts to this calculation that could change the threshold level. For example, if the working age population grows faster or slower than assumed or if the participation rate changes. For reference, for every 0.1% increase in the growth rate of working age population, the monthly threshold level increases by 13,000. The five-year compound annual growth rate (CAGR) of the US labour force prior to the covid crisis was around 1.0%. If that is used instead of 0.7% it would suggest a current threshold level of around 134,000 (also shown in the table). Trivially, every 1% increase in the participation rate increases the monthly threshold level by just 2,000.
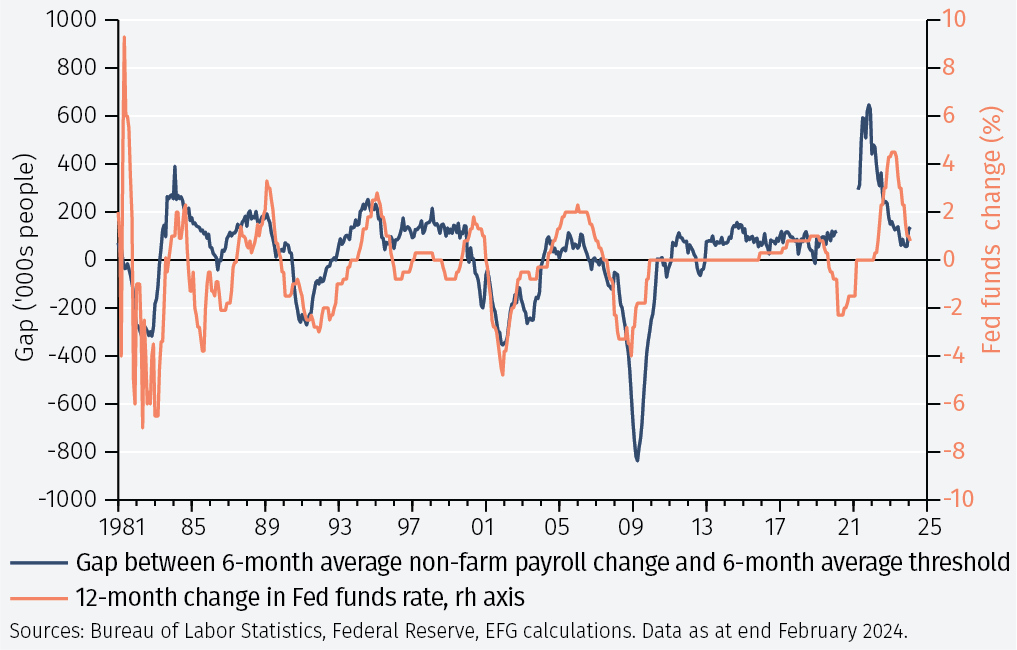
Figure 3 shows the close relationship with Fed policy. The chart highlights how the Fed funds rate has tended to increase when non-farm payrolls are increasing by more than the threshold and decrease when non-farm payrolls are below the threshold. Because the data can jump around from month to month, six month moving averages of the change in non-farm payrolls and the estimated threshold level are used – this gives a better indication of the underlying state of the US labour market whilst eliminating some of the noise. The correlation coefficient between the 12-month change in the Fed funds rate and the non-farm payrolls-threshold gap is 53.0%.
Conclusion
The US labour market is complicated and these numbers should not be taken as being overly precise. Furthermore, the Fed looks at a range of factors – not least inflation, measures of labour demand and labour market trends - when considering whether or not to change its policy. And we should not obsess too much over a single month’s data. However, if over a period of a few months we see the change in non-farm payrolls consistently higher or lower than the threshold level identified in this report – currently around 100,000 to 130,000 per month – then it will be a good indication of a change in labour market conditions. That, in turn, may be a significant factor in influencing Fed policy and market sentiment.
Important Information
The value of investments and the income derived from them can fall as well as rise, and past performance is no indicator of future performance. Investment products may be subject to investment risks involving, but not limited to, possible loss of all or part of the principal invested.
This document does not constitute and shall not be construed as a prospectus, advertisement, public offering or placement of, nor a recommendation to buy, sell, hold or solicit, any investment, security, other financial instrument or other product or service. It is not intended to be a final representation of the terms and conditions of any investment, security, other financial instrument or other product or service. This document is for general information only and is not intended as investment advice or any other specific recommendation as to any particular course of action or inaction. The information in this document does not take into account the specific investment objectives, financial situation or particular needs of the recipient. You should seek your own professional advice suitable to your particular circumstances prior to making any investment or if you are in doubt as to the information in this document.
Although information in this document has been obtained from sources believed to be reliable, no member of the EFG group represents or warrants its accuracy, and such information may be incomplete or condensed. Any opinions in this document are subject to change without notice. This document may contain personal opinions which do not necessarily reflect the position of any member of the EFG group. To the fullest extent permissible by law, no member of the EFG group shall be responsible for the consequences of any errors or omissions herein, or reliance upon any opinion or statement contained herein, and each member of the EFG group expressly disclaims any liability, including (without limitation) liability for incidental or consequential damages, arising from the same or resulting from any action or inaction on the part of the recipient in reliance on this document.
The availability of this document in any jurisdiction or country may be contrary to local law or regulation and persons who come into possession of this document should inform themselves of and observe any restrictions. This document may not be reproduced, disclosed or distributed (in whole or in part) to any other person without prior written permission from an authorised member of the EFG group.
This document has been produced by EFG Asset Management (UK) Limited for use by the EFG group and the worldwide subsidiaries and affiliates within the EFG group. EFG Asset Management (UK) Limited is authorised and regulated by the UK Financial Conduct Authority, registered no. 7389746. Registered address: EFG Asset Management (UK) Limited, Park House, 116 Park Street, London W1K 6AP, United Kingdom, telephone +44 (0)20 7491 9111.
What type of investor are you?
to view the content you have selected, please choose your country/region and then investor type from the menu:
![]()
You’re about to leave EFGAM website and enter into a 3rd party website
Third party website disclaimer
You are about to enter a third party website, which is owned and operated by an independent party over which EFGAM has no control ("3rd Party Website"). Any link you make to or from the 3rd Party Website will be at your own risk. Any use of the 3rd Party Website will be subject to and any information you provide will be governed by the terms of the 3rd Party Website, including those relating to confidentiality, data privacy and security.
EFGAM does not endorse or approve and makes no warranties, representations or undertakings relating to the content of the 3rd Party Website. EFGAM disclaims liability for any loss, damage and any other consequence resulting directly or indirectly from or relating to your access to the 3rd Party Website or any information that you may provide or any transaction conducted on or via the 3rd Party Web site or the failure of any information, goods or services posted or offered at the 3rd Party Website or any error, omission or misrepresentation on the 3rd Party Website or any computer virus arising from or system failure associated with the 3rd Party Website.
By clicking "Proceed", you confirm that you have read and agreed to the terms herein.